
Have you ever wonder which is the fastest way to access a value in a dictionary in Python?
What happens if the key doesn’t exist?
Is the time constant depending on the size of the dictionary?
In the current article, I’ve tried to answer those questions. I made a small benchmark where I try to figure out which is the fastest way to read a dictionary in Python.
I’ve done the tests using Python 3.11 on my MacBook Pro, i7 with 6 cores and 16Gb of RAM.
Context
This benchmark came to me when I was optimizing a search system. The question I’ve asked to me were:
- If I use a bigger dictionary, would it take more time to read the values?
- Should I add as many keys as possible to avoid checking for missing keys?
The Benchmark
The three main methods I know to read values from a dictionary if a safe form are the following:
if key in dict:
    return dict[key]
else:
    return None
try:
    return dict[key]
except KeyError:
    return None
dict.get(key, None)
Sometimes I may find the value and sometimes I may miss the key. I must be prepared for both.
def get_value(key, dict, method):
    if method == 1:
        if key in dict:
            return dict[key]
        else:
            return None
    elif method == 2:
        try:
            return dict[key]
        except KeyError:
            return None
    elif method == 3:
        return dict.get(key, None)


for method in [1, 2, 3]:
    ...
The first thing I want to test is the size. So, I will create a loop with different sizes of dictionaries.
for size in [100, 1000, 10000, 100000, 1000000, 10000000]:
The second thing I want to test is using the method when I have a high percentage of hits and a high percentage of misses.
key = f"key_{key}"
To be the benchmark the most real as possible, I will avoid having numbers as keys in the dictionary. Because Python may sort them or perform some mathematical operation to find the key/value faster.
for i in range(size):
    dict[f"key_{i}"] = i
The results
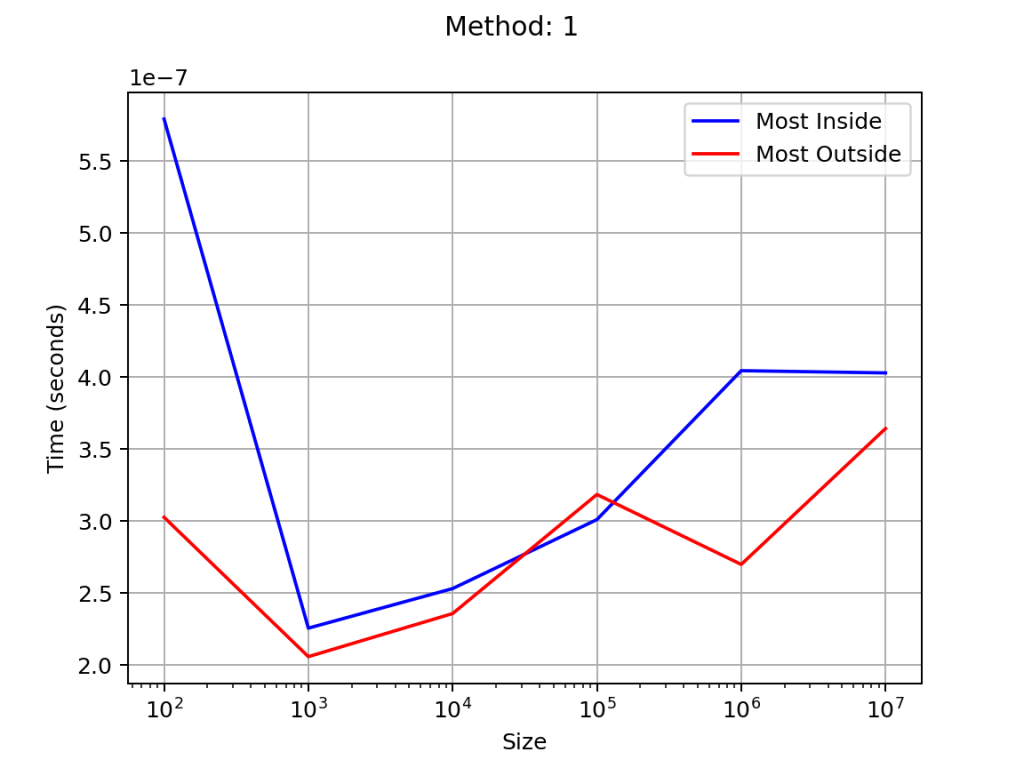
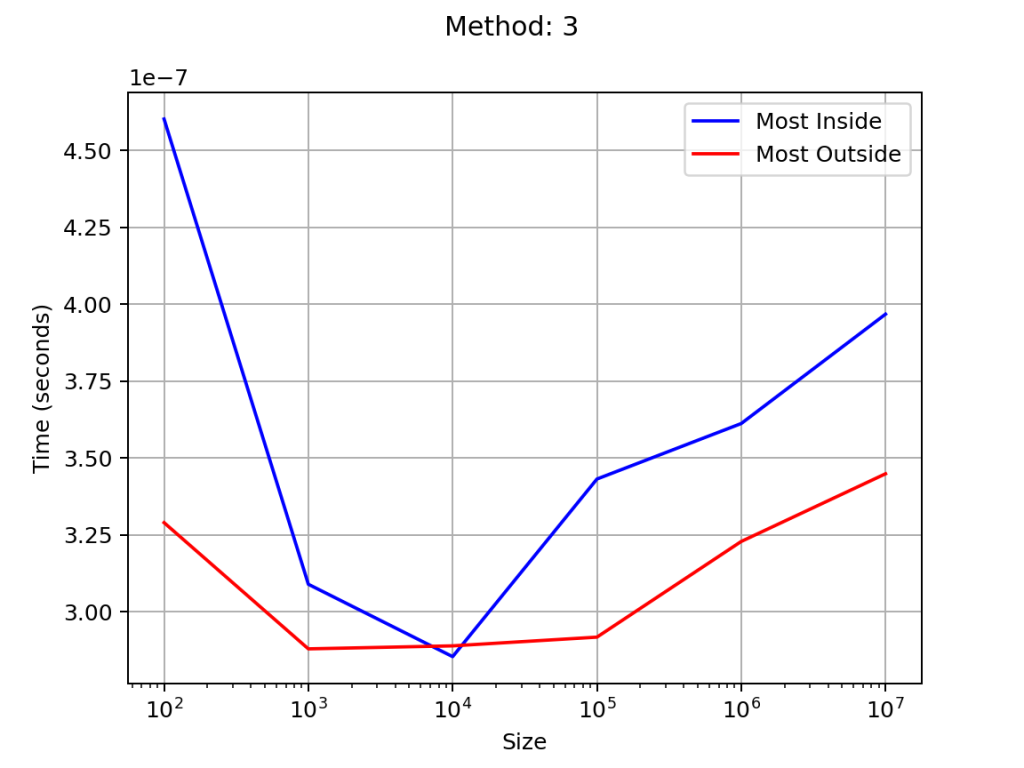
The first thing I notice, is that for methods 1 and 3, the read access is not optimized for small dictionaries. Then, the time response increases slowly with the dictionary size.
The method 2 is best used when there is a high percentage of hits. And the method 3 is best used when there is a high percentage of misses.
But as described at the beginning, the methods used and benchmarked are only for read operations. I don’t know the evolution of the times response when adding, editing or deleting keys/values.

The Complete Code
Here is the complete code
import logging
import random
import time

from matplotlib.figure import Figure


LOGGER = logging.getLogger(__name__)


def get_value(key, dict, method):
    key = f"key_{key}"
    if method == 1:
        if key in dict:
            return dict[key]
        else:
            return None
    elif method == 2:
        try:
            return dict[key]
        except KeyError:
            return None
    elif method == 3:
        return dict.get(key, None)


for method in [1, 2, 3]:
    times = {
        "most_inside": {},
        "most_outside": {},
    }
    for size in [100, 1000, 10000, 100000, 1000000, 10000000]:
        d = {}
        for i in range(size):
            d[f"key_{i}"] = i

        start = time.time()
        # test 80% inside the dict
        for i in range(int(size / 5)):
            random_key = random.randint(0, int(size * 1.25))
            LOGGER.info(get_value(random_key, d, method))
        end = time.time()
        print(f"method: {method}, size: {size}, time: {(end - start) / size} seconds")
        times["most_inside"][size] = (end - start) / size

        start = time.time()
        # test 20% inside the dict
        for i in range(int(size / 5)):
            random_key = random.randint(0, int(size * 500))
            LOGGER.info(get_value(random_key, d, method))
        end = time.time()
        print(f"method: {method}, size: {size}, time: {(end - start) / size} seconds")
        times["most_outside"][size] = (end - start) / size

    # plot two graphs with the times
    fig = Figure()
    fig.suptitle("Method: " + str(method))
    axis_first = fig.add_subplot(1, 1, 1)
    axis_first.set_xscale('log')
    axis_first.set_xlabel("Size")
    axis_first.set_ylabel("Time (seconds)")
    axis_first.grid(True)
    axis_first.plot(times["most_inside"].keys(), times["most_inside"].values(), label="Most Inside", color="blue")
    axis_first.plot(times["most_outside"].keys(), times["most_outside"].values(), label="Most Outside", color="red")
    axis_first.legend()

    filename = f"pict_{method}.png"
    fig.savefig(filename, format="png", dpi=180)
And here are the exact times used to create the graphs.
method: 1, size: 100, time: 5.793571472167969e-07 seconds
method: 1, size: 100, time: 3.027915954589844e-07 seconds
method: 1, size: 1000, time: 2.2578239440917968e-07 seconds
method: 1, size: 1000, time: 2.0599365234375e-07 seconds
method: 1, size: 10000, time: 2.5327205657958985e-07 seconds
method: 1, size: 10000, time: 2.359151840209961e-07 seconds
method: 1, size: 100000, time: 3.0118942260742187e-07 seconds
method: 1, size: 100000, time: 3.1860828399658205e-07 seconds
method: 1, size: 1000000, time: 4.0459203720092773e-07 seconds
method: 1, size: 1000000, time: 2.700331211090088e-07 seconds
method: 1, size: 10000000, time: 4.0304818153381347e-07 seconds
method: 1, size: 10000000, time: 3.644050121307373e-07 seconds
method: 2, size: 100, time: 4.029273986816406e-07 seconds
method: 2, size: 100, time: 4.100799560546875e-07 seconds
method: 2, size: 1000, time: 4.2605400085449217e-07 seconds
method: 2, size: 1000, time: 5.147457122802734e-07 seconds
method: 2, size: 10000, time: 3.3559799194335937e-07 seconds
method: 2, size: 10000, time: 4.15802001953125e-07 seconds
method: 2, size: 100000, time: 3.285312652587891e-07 seconds
method: 2, size: 100000, time: 3.698611259460449e-07 seconds
method: 2, size: 1000000, time: 3.3728885650634767e-07 seconds
method: 2, size: 1000000, time: 4.4146490097045896e-07 seconds
method: 2, size: 10000000, time: 4.3451929092407226e-07 seconds
method: 2, size: 10000000, time: 4.770605087280273e-07 seconds
method: 3, size: 100, time: 4.601478576660156e-07 seconds
method: 3, size: 100, time: 3.290176391601562e-07 seconds
method: 3, size: 1000, time: 3.08990478515625e-07 seconds
method: 3, size: 1000, time: 2.880096435546875e-07 seconds
method: 3, size: 10000, time: 2.8548240661621094e-07 seconds
method: 3, size: 10000, time: 2.889871597290039e-07 seconds
method: 3, size: 100000, time: 3.4318923950195314e-07 seconds
method: 3, size: 100000, time: 2.918195724487305e-07 seconds
method: 3, size: 1000000, time: 3.612179756164551e-07 seconds
method: 3, size: 1000000, time: 3.229031562805176e-07 seconds
method: 3, size: 10000000, time: 3.967489004135132e-07 seconds
method: 3, size: 10000000, time: 3.448911905288696e-07 seconds
If you want to learn more about good quality code, make sure to follow me on Youtube.

Leave a comment