In this article I will show how to trace requests between microservices using Spring Cloud Sleuth and Zipkin. Spring Cloud Sleuth will help me identify the logs from a single request between all the microservices. And Zipkin will show me the elapsed times at the microservices.
Content
- Tracing Microservices
- Spring Cloud Sleuth
- Zipkin
- Custom Span ID
Watch this video for more details.
All the code is available in this repository.
Tracing Microservices
I am in a microservice architecture. The request travels a lot of microservices. This generates a lot of logs. How to find the path of a request? How to find the microservice which generates the latency?
Those are the typical question I ask myself when I try to profile a microservice architecture. In this article, with Spring Sleuth and Zipkin, I can solve the problem. Let’s start with Spring Sleuth.
Spring Cloud Sleuth marks every line of log created by each request. Those marks will continue from microservice to microservice. And Zipkin reads all this information and draws some graphs to easily discover latencies between the microservices.
Spring Cloud Sleuth marks every line of log with two informations: a Trace ID and a Span ID. The Trace ID is a unique identifier for a request, for a request made from the end user. Each request made within my microservice architecture will be marked with this Trace ID. On the other side, the Span ID is a unique identifier within each microservice. I will have a different Span ID at each microservice request from my end user requests.
And if there is some important process I want to monitor inside a single microservice, I can create some inner spans to obtain a more fine grained traceability.
Spring Cloud Sleuth
This way, having the trace ID of my end user, I can follow all the requests made between all microservices. Let’s start by adding the Maven dependency.
        <dependency>
			<groupId>org.springframework.cloud</groupId>
			<artifactId>spring-cloud-starter-sleuth</artifactId>
		</dependency>
And that’s all. Spring Cloud Sleuth will automatically add the trace ID and the span ID to all my logs.
If I send a request to my application, a request which will work on multiple microservices, I will be able to see those Trace ID and Span ID.

Each line of log have a new block of information, [<microservice-name>, <trace-id>, <span-id>]. It contains first the name of the microservice, then the Trace ID and then the Span ID. I will find the same Trace ID in all the logs of my microservices impacted. On the other side, the Span ID corresponds to an identifier created by these only microservers.
If I aggregate all my logs in a single system like ElasticSearch and Kibana, it will be easy to locate logs from each of my microservices, or the logs for a single request.
Nevertheless, not all the logs contain the Trace ID and Span ID. The logs generate at the startup of the application, or due to some scheduled task don’t have the Trace nor the Span ID. This is because those logs were generated outside a request. But I can also assign them a Span ID. I will do it in a few moments.
Zipkin
Okay, this makes me easy to read the logs, but this doesn’t solve the original problem which is find the microservice which generates the slowness. For that, let’s go with Zipkin. Zipkin will work with Spring Cloud Sleuth. Spring Sleuth will send the microservice name, the Trace ID, the Span ID, the initial time and the end time for each request for each microservice. This will be collected by Zipkin to show some very useful information. I will first need the Maven dependency.
        <dependency>
			<groupId>org.springframework.cloud</groupId>
			<artifactId>spring-cloud-sleuth-zipkin</artifactId>
		</dependency>
And now, to configure the communication between both, I need only this configuration in the application.yaml.
spring:
  zipkin:
    baseUrl: http://127.0.0.1:9411/
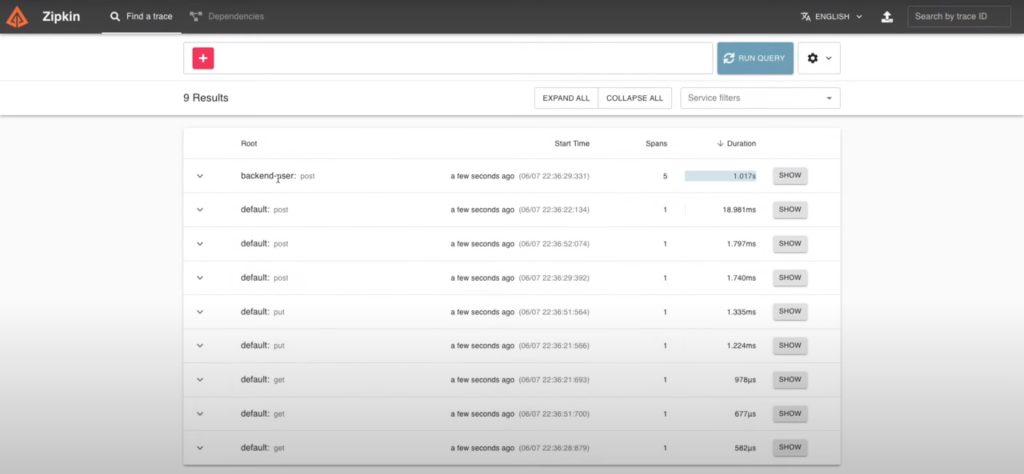
In the Zipkin interface, I can search by time range for any request. Clicking at any result will let me see the details of the request.
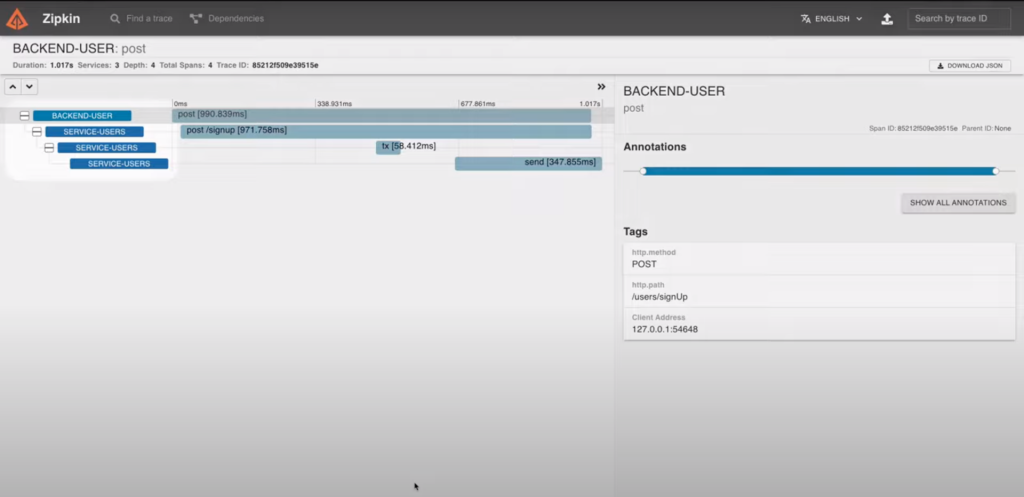
I can see all the microservices impacted during my request. The bars indicate me the time elapsed at each microservice. And Spring Sleuth also recognize some external services as the database transactions or Kafka.
I can see that the time elapsed in the first microservice is the largest one. But it’s waiting for the response time of all the inner microservices. In fact, most of the time is consumed by the second line.
Another point I can see here is that the Kafka operation (the fourth line) continues after the request finishes. This means that the Kafka operation was created in another thread and the operations continues even if the request finishes.
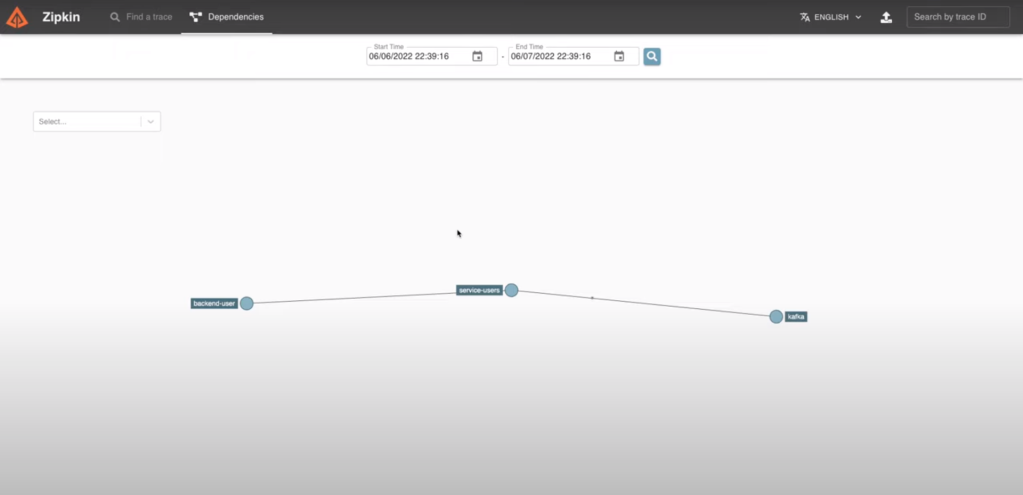
The last tab shows me the dependencies between the microservices for this request. In my case, nothing very interesting. But this can be useful when dozens of microservices interact for a single request.
Custom Span ID
For some operations I want to trace, operations I want to monitor, I can create an inner Span ID that will appear in a separated line at Zipkin. There is a lot of configuration I can do with a Span: adding tags, events or more. But I will just create an inner span to see the new line at Zipkin.
    @NewSpan("send-email")
    public void sendUserWelcomeMail(UserDto userDto) {
        log.info("Sending a creation email for {}", userDto.getLogin());
        kafkaTemplate.send("mails", "user.creation: " + userDto.getLogin());
    }
With the annotation @NewSpan, the method sendUserWelcomeMail will have a dedicated Span ID while the execution is inside. Once it exits this method, it will continue with the parent span and so on. Let’s see the difference now at Zipkin.
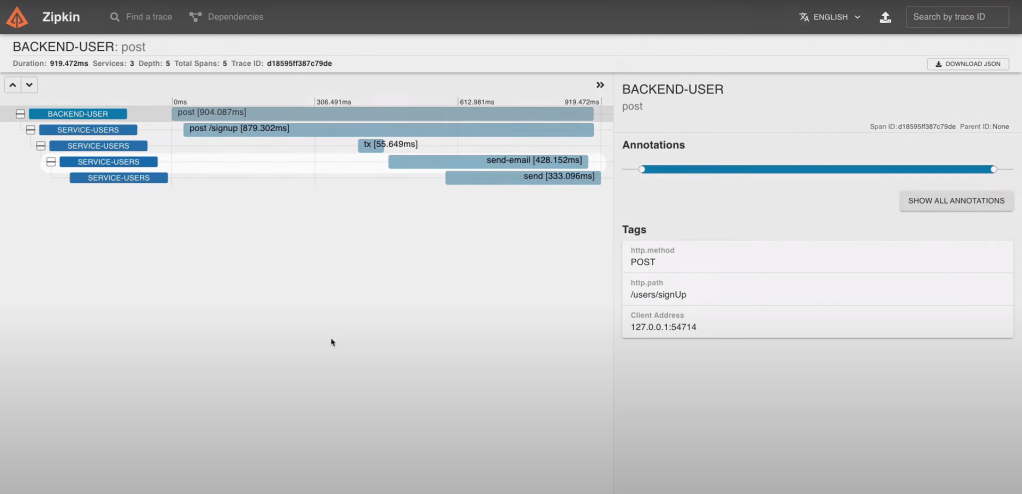
This time, I have the new line with the name I’ve indicated. This way, I see the time elapsed in the previous method. This is very useful when I have microservices which perform a lot of different actions. Dividing them in multiple spans will help a lot to identify the bottlenecks.
Conclusion
- For Spring Cloud Sleuth, I’ve added the Sleuth Maven dependency. By default, it will create a Trace ID and a Span ID for each request of the microservices. Those Trace ID and Span ID will be added at each line of log.
- I can also add some new named Span ID with the notation @NewSpan.
- For Zipkin, I’ve also added the Zipkin Maven dependency.
- I’ve added the location of the instance to let Sleuth communicate with Zipkin.
- Then, in Zipkin, I can see the time elapsed at each microservice and at each span for a single request.

Leave a comment